Quality assurance is an important function in companies. Quality assurance is about an optimization process that regularly achieves the level of quality required to meet the functionality expected by customers without adding unnecessary effort beyond that. The customer’s willingness to pay is the currency with which quality is weighed up.
Quality assurance expectations
Quality expectations are defined by the target customers. Therefore, a clear positioning in the market is an essential prerequisite for the specifications of the quality level to be met. Because the criteria for quality are directly dependent on the strategic alignment, meaningful quality management must be linked to the strategic alignment. If the strategic orientation is blurred, quality management will not be able to deliver optimal results.
To avoid misunderstandings: If the strategy specifies cost and price leadership, good quality management will focus on achieving cost and price leadership. The focus for quality assurance will then be to implement the level of quality required for the products or services to be accepted by target customers right now. Any effort to achieve a higher level of quality should be discarded if this would increase costs or prices. Quality targets are thus defined in top management by strategic specifications which are ideally based on demand and competition.
Quality management vs. quality assurance
Quality management is part of the top management process. Quality management defines the specifications for system, process and product quality. In addition, quality management serves to develop and operate a system of processes that enables the defined product quality to be achieved on a regular basis.
Effective quality assurance depends heavily on the quality management system and its ability to ensure high process quality. The recommendation of such a process focus was documented with the amended DIN-EN-ISO 9001-2015 standard, according to which organizations can have their quality management systems certified.
Good processes are characterized by the fact that they minimize the probability of risks and, in the event that a risk does occur, keep the risk effects manageable. An essential component of effective quality management is therefore to create conditions that rule out the occurrence of risks as far as possible. Effective risk management is based on statistical principles from which operational measures to avert or mitigate risk are derived.
Quality assurance is an operational function in operations management whose task is to ensure that the specifications of quality management are regularly fulfilled in operational practice within the framework of the defined processes. In quality assurance, suitable methods are selected and used for this purpose. Quality assurance is in the role of the executive, so to speak, while quality management takes on the role of the legislative. However, quality assurance is not just a function downstream from quality management, but should be seen as part of quality management. Quality management is thus an overall concept for optimizing quality, although optimization should not be equated with maximization.
Inadequate quality is just as expensive as excessive quality. To avoid customer dissatisfaction on the one hand and unappreciated blind effort on the other, both quality management and quality assurance must run through the entire business process. Not only rework and rejects, but also customer complaints and customer losses often cost more than appropriate measures to ensure commercially acceptable quality. Cost pressure basically forces functioning quality management and quality assurance.
Quality assurance methods
Preventive and reparative measures: Optimization of quality costs
Quality management specifies measures with which the defined quality level is to be achieved on a regular basis. The measures are strictly divided into preventive measures and corrective measures.
In organizations where integrated quality management is not in use, reparative measures will predominate. Accordingly, resources will be focused on correcting errors that have occurred and mitigating damage. Activities such as checking quality after work has been carried out, sorting out faulty goods, reworking faulty items, dealing with rejects, handling customer complaints and winning back customers will be the main focus at such companies. These are quality assurance activities in character.
In organizations that have integrated quality management in place, preventive quality assurance measures are taken. These include defining robust processes and managing quality by the quality of the processes. The philosophy is that product quality will meet requirements if sufficient process quality is defined and the processes are reliably followed. Thus, it is no longer the properties of each item that are checked, but rather the process parameters. To do this, the processes must be kept within a “green zone” by suitable control, which statistically ensures commercially acceptable product quality. To get there, training is required. Regulation of processes and personnel training are also preventive quality measures.
The more comprehensive and effective the preventive measures are chosen, the less the reparative measures will be. Unfortunately, however, maximizing preventive measures is not the silver bullet. This is because the cost of quality is defined as the sum of the costs of preventive and reparative measures. So the mix of preventive and reparative measures must be optimized to meet quality requirements at the minimum possible cost. This optimization task is an ongoing challenge in quality management.
Continuous improvement process (CIP)
What is the use of a continuous improvement process?
Closely related to quality assurance is the method of the continuous improvement process. The idea behind this is to reflect critically on the existing working methods again and again and to look for further possibilities for improvement. In this way, a series of small improvement steps results in an ever higher level of quality or decreasing quality costs. The challenge in continuous improvement is to find the right measure. It is not a matter of course to introduce a continuous improvement process at all and keep it alive. On the other hand, the level of quality should not be increased beyond what customers are willing to pay for. Above all, it is a matter of ensuring that the defined quality is achieved with a high degree of probability. Often, the continuous improvement process is also about delivering commercially reasonable quality at ever lower cost.
In the context of quality assurance, continuous improvement is about developing the methods and means used to ensure product quality. The goals of continuous improvement are to ensure, with less effort, that the defined product quality is reliably achieved or that the product quality is achieved in a modified manner. Continuous improvement can therefore relate both to the product creation itself and to the way in which product quality is verified.
How can a continuous improvement process be introduced in companies?
A continuous improvement process can be introduced into quality assurance by training employees in quality assurance and operational business functions to constantly critique their work and develop it incrementally. Managers should demand and value employees’ own commitment to ongoing improvements by ensuring that the ideas contributed for ongoing improvement are transparently reviewed, assessed and, if suitable, put into practice.
Innovation process: When the existing no longer carries on
What is the use of an innovation process?
The innovation process is another element of quality assurance. However, the innovation process is quite different from the continuous improvement process. The innovation process is about creating the conditions to develop completely new approaches beyond the existing, the familiar, the routine, to achieve the defined quality or to verify the achieved quality level.
Innovation thus involves completely new methods of quality assurance or completely different processes and/or materials of product creation. Innovation begins with the creative development of ideas and continues through the conceptual elaboration to the successful introduction of an innovation.
How can an innovation process be introduced into quality assurance?
Usually, established procedures, methods and paths are only abandoned when they no longer deliver desired results. Often, it is only then that a creative process is set in motion to find new ways. We live in a fast-moving (economic) world in which cycles are becoming shorter. That’s why paths taken reach their limits sooner than was previously the case. In this respect, the question arises as to whether a bottleneck always has to be present before new approaches can be sought, or whether an innovation process for quality assurance cannot be introduced, via which completely new approaches are continuously sought.
The quality circle
As early as the 1980s, Edward Deming introduced the quality circle to corporate management, which now consists of five steps and forms a basis for quality management that conforms to standards:
Objective setting
The first step on the way to achieving results is to set objectives. The objectives should be as specific as possible so that their degree of achievement can be measured. The SMART principle has proven to be useful for setting objectives:
Goals should be
- specific,
- measurable,
- ambitious and
- realistic
- as well as be provided with a deadline.
Measure
The results achieved must not only be measurable, but also measured. Only what is measured can be assessed.
Analyze
In the next step, the measured results must be compared with the set goals and deviations analyzed. To determine the causes of the deviations, the root cause analysis method is recommended.
Adjust (act)
The next step is to eliminate the identified causes of the deviations by introducing appropriate measures.
Evaluate
Finally, it must be evaluated whether the measures are actually effective and are reflected in improved results. If not, either better measures can be taken or the targets can be adjusted.
Recording of quality key figures
Quality indicators are values that result from the expression of certain characteristics (variables) for characteristic carriers. Characteristics can be divided into three categories, which suggest various useful evaluation options.
The expression of quantitative characteristics can be measured unambiguously. Any number within a reasonable range can be used as a measurement value. Such variables are therefore usually continuous or steady.
- Quantitative characteristics are suitable for determining the standard deviation, which is a measure of the variability of characteristic expressions.
- Ordinal characteristics are characteristics whose expression can be classified on a scale. These can be, for example, assessments or ratings. Such scales usually force an assignment to a level. The variables are therefore discontinuous or discrete.
- Qualitative characteristics are discrete states such as “color red”, “aggregate state liquid”, “reject” or “good” etc.. An average value for such characteristics does not make sense.
Measured values of characteristics fluctuate or scatter due to systematic deviations, random deviations or measurement errors. Causes of such deviations can be the 5 “M” the human (process control), the machine (vibrations, wear etc.), the method, the material (e.g. the chemical composition) and the environment (heat, cold, dust etc.).
There are several ways to measure the expression of such characteristics. Some characteristics can be taken from 1:1 measurements or counts. Others can only be determined statistically. To simplify the evaluation, the measurements can be rounded and combined into measurement classes or categories.
Statistical methods are generally used for large basic totals. A distinction is made between descriptive and inductive statistics.
- Descriptive statistics are used to describe characteristics of existing data by recognizing rules and evaluating the data according to these rules, for example, to recognize equality, sums, averages, rankings or developments over time.
- Inductive statistics is useful for inferring overall data from representative sample data. This can be useful when it would be too burdensome to collect the expression of the characteristics (variables) of the population.
In the course of evaluating a sample, the absolute frequency of the relevant characteristic values is first determined. The distribution of the measured values of a variable results in the frequency distribution. Now, the values of each characteristic expression can be related to the sample size and the relative frequency distribution is obtained, which is usually expressed as a percentage.
Statistical key figures for quality management
The modal value (Mod) is the value of a measurement series that occurs most frequently. If two or more values occur frequently, we are dealing with a bimodal or a polymodal distribution.
The median (Md) is the value of a measurement series that divides the values sorted by size into two halves of exactly equal size.
The percentile or quartile indicates the value that is not exceeded or fallen short of by p percent of the characteristic carriers.
The arithmetic mean is the quotient of the sum of all measured values and the number of measured values. It is the mean of all measured values.
For growth trends, the geometric mean is recommended, which is the nth root of the quotient of the final value and the initial value. N is the number of periods considered.
Distributions of measured values do not have to be symmetrical. A unimodal, symmetric distribution is the Gaussian normal distribution. However, a right-skewed or a left-skewed distribution may also be present.
The distribution of the expressions around the center point is the dispersion of the measured values. If the arithmetic mean is the same, the dispersion can be very different. The measure of dispersion is the average deviation of the measured values from the arithmetic mean (average deviation AD). The smaller the scatter, the more stable the process. In practice, one would like to give particularly large deviations from the mean value extra weight. This can be taken into account by including the squares of the deviations in the scatter calculation. The dispersion determined in this way is called the variance σ2. The root of the variance is the standard deviation σ. It quantifies the frequency distribution of the measured values of a series of measurements around a mean value. The standard deviation is meaningful for unimodal, approximately symmetrical distributions.
In the case of a Gaussian normal distribution, exactly 2/3 of all characteristic carriers lie in the range between the scale value x – σ and the scale value x + σ and exactly 95 % of all characteristic carriers lie in the range between the scale value x – 2σ and the scale value x + 2σ.
The range, i.e. the variation between the smallest and the largest measured value, is also relevant. To prevent outliers from distorting the statement, it makes sense to exclude the lowest and the highest 5 %, i.e. the first 5 and the last 5 percentiles, from the analysis.
Probability calculation for quality management
In the case of future operations that are subject to certain fluctuations, such as the duration of setup times, the repair time, the reject rate, etc., probability calculation can help to arrive at reasonable assumptions despite the uncertainty. The underlying idea is that the average value of a sufficiently large number of known operations approximates the probable value for future operations. It is important to keep in mind that a given past history has no influence on the future. According to Joseph Bertrand, French mathematician, statistics “has neither conscience nor memory”.
Laplace’s concept of probability gives the ratio of favorable cases to the number of all cases. The probability of compound events (How probable is it to roll a “4” with two dice or in sum a number of eyes of “6”?) can be calculated mathematically with the addition theorem. The probability of coupled events (How likely is it to roll first “1” and then “6”?) can be calculated with the multiplication theorem. (How likely is it to roll a “6” at least once in three rolls?): P = 1 – (½ x ½ x ½) = 7/8.
It can also be interesting to calculate the probability of an event when only incomplete information is available. (You want to roll a “1”, but all you know about your roll is that it is an odd number. Then the probability that you rolled a “1” is: P = 1/3.
Combinatorics can also be useful to calculate the probability of events. Permutations (with and without repetition) are especially handy.
Key figures for quality assurance
What are key figures needed for in quality assurance?
Production processes are complex. Plant availability, production performance, production costs and production quality are influenced by many adjacent functions that interact with each other and with production. Accordingly, the assessment of production performance must be multi-faceted. A single performance figure can provide an overall view, but it is not suitable for specifically capturing the actual conditions in production and optimizing them. Other key performance indicators are required for operational management and improvement of key production data.
It makes sense not only to use simple measured values in production, but also key figures that relate different measured values to each other or measured values to targets. In this way, dependencies can be shown.
In addition, time series of key figures are recommended in order to recognize tendencies and to guide developments.
Which key figures are useful for quality assurance?
In order to record the performance and effectiveness of quality assurance and to develop it in a targeted manner, QA indicators provide a basis. The development over time can be used to determine whether measures are really taking effect and where there is potential for improvement. Trends can also be identified. This information can be used to intervene in a controlling manner. As a result, internal processes can be stabilized, costs reduced and customer requirements met more regularly.
QA key figures can be created and recorded along the entire business process. This is not a topic for a “quality assurance” department, but an overarching general management topic. In this respect, management should ensure that all processes carried out in the company provide key performance indicators. These key figures are recorded in the operational functions, i.e., in production, logistics, sales, administration, etc. However, these QM indicators only become valuable when they are linked. Only then can measures for holistic optimization be derived. The realization that holistic optimization is usually a compromise is particularly important. If an attempt were made to optimize each key performance indicator separately, this would lead to conflicts of interest, friction and collisions. When considering individual key figures, therefore, attention must always be paid to their contribution to the overall result.
QM costs consist of the sum of preventive and reparative QM costs. Therefore, the separate recording of all preventive and all reparative quality expenses is interesting. The analysis can lead to an optimization of the total costs by either increasing or decreasing the commitment to preventive measures. Preventive measures include process improvement initiatives, standardization, training and audits. Repairable measures include scrap, rework costs, loss of capacity, and costs for any over-specification, as well as loss of reputation and customers, and the associated recovery effort.
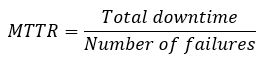
Availability is also affected by the reliability of machinery and equipment. A common metric for reliability is Mean Time to Repair (MTTR).
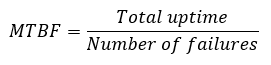
Another key figure useful for production is the Mean Time between Failure (MTBF), which shows the reliability of machines and systems. MTBF indicates the average time during which the machine or system operates without malfunction. It is thus a measure of the process risk.
Production failures: How can production downtime be measured in a meaningful way?
Production downtimes can be listed. Modern CNC machines linked to a production data acquisition system can automatically record production downtimes with their times. Reasons can be assigned to the downtimes. On a rough level, a distinction is made between organizational and technical reasons. Organizational reasons include, for example, lack of materials, lack of personnel and additional setup operations required at short notice. Technical reasons include plant faults, unsuitable starting material, tool breakage and recognized quality defects.
Total machine downtime = Machine setup time + Downtime for organizational and technical reasons
Derived from the MTBF, the Probability Failure per Hour (PFH) is also used as a key figure that reflects the average probability of a failure per hour.
In mechanical and plant engineering, where smaller batch sizes are produced, the “Performance Level” is often used in accordance with EN ISO 13849-1.
In the process industry and in manufacturing companies with large batch sizes (mass production), the “Safety Integrity Level” according to IEC 62061 is popularly used, which was originally developed for electrical, electronic systems and for programmable systems.
Production scrap: How can production scrap be monitored and assessed?
Production scrap is another important production metric. Production scrap is measured as the quotient of the scrap quantity divided by the total production quantity.
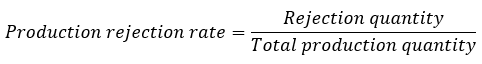
Particularly in the case of the scrap ratio, attention must be paid to what the scrap refers to: to the total production quantity or to the yield. For low scrap rates, this distinction is irrelevant. If, however, 50% of the quantity produced is scrap, then the scrap rate in relation to the yield is 100%. This extreme example illustrates how misunderstandings can arise if the reference quantity is not clearly defined.
Scrap consumes material, causes personnel costs and runs through production machines, thus taking up capacity and energy.
Delivery reliability: How many orders are delivered completely and on time?
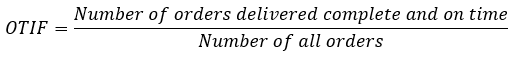
Delivery reliability is significantly, but not exclusively, influenced by production. It is defined by the proportion of orders that are delivered in full and on time as a percentage of the total number of orders. Delivery reliability is defined by the supply chain management metric OTIF (on-time in full).
To determine OTIF, the number of orders that have been shipped out or delivered on the agreed date (OT) and the number of orders that have been delivered in full (IF) must be recorded.
Maintenance costs: How can maintenance costs be monitored?
Maintenance and repair costs increase with increasing machine age. At the same time, financing costs decrease when machines are largely paid for. In this respect, maintenance and repair costs compete with investments for new machines or plants.
Arguments against old machines can be the decreasing reliability and availability. As the risk of failure increases, process quality decreases throughout production and throughout the company. Resulting production backlogs can cause very high costs. For machines that are only used occasionally, this consideration may not be critical, but for machines that have a significant influence on the production process, an analysis is recommended as a basis for decision-making.
In this respect, it is advisable to weigh up the total costs for existing machines against the total costs for new machines.
Ideal sample size
A typical question in quality assurance is how large a sample must be in order to make a valid statement about how likely the occurrence of an event is in the total set. Answering this question is not trivial at all.
What is the issue here? Both sampling and analysis are expensive. But the smaller the sample is chosen, the higher the probability that the statement obtained from the sample is not representative and therefore erroneous. The larger the sample, the closer the result obtained will be to the value for the total set. The deviation between the probable sample result and reality is called the confidence interval. The result is given as the sample result +/- the confidence interval. This means that an event will occur with a certain probability, but a dispersion of this probability in the order of the confidence interval must be taken into account. The confidence level (in percent) indicates how likely it is that the actual outcome will be within a certain tolerance around the sample result. The higher the confidence level, the more accurate the sample is in inferring the events studied in the total set.
The required sample size can be determined using the standard deviation σ. Usually, a standard deviation σ = 0.5 is applied to arrive at a meaningful sample size. From the confidence level, a Z-value is determined, which represents the distance between the value and the actual value of the total quantity. The Z-value can be taken from statistical tables. As an example, the Z-values are shown as a function of selected confidence levels:
| Confidence level | Z value |
| 0,80 | 1,28 |
| 0,85 | 1,44 |
| 0,90 | 1,65 |
| 0,95 | 1,95 |
The minimum size of a sample is derived from the following formula:
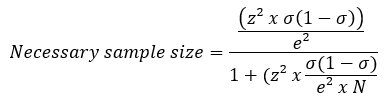
N = Total quantity (e. g.: 100.000)
σ = Standard deviation (e. g.: 0,5)
e = Error margin (e. g.: 0,1)
Z = Z value (e. g.: 1,96)
In this example, the minimum sample size is 96.04/1.0009604 = 95.9475
Software for quality management
An established quality management system follows standardized processes. Digitization of these standardized processes enables both integration of quality management into the IT infrastructure and automation of the processes. This can reduce the susceptibility of the processes to errors.
In addition, digitized processes can be tracked and traced more easily. Employees are supported in the planning, implementation and monitoring of quality measures. And all specification and verification documents can be managed and administered in an audit-proof manner. As a result, document management is simplified and the administrative effort is reduced.
The necessary technological options for digitizing quality management processes are available. In order for digital quality management to work and find acceptance in the company, there are a few things to keep in mind: Digital quality management must be fully integrated into the IT infrastructure in the company. In particular, access to data from the ERP system and from production planning must be available. In addition, relevant information must be integrated into digital quality management regardless of the end devices used. Nothing is worse than system breaks and incomplete or inconsistent data. Audits should be carried out in digital quality management, as should the management of measures, including training, and risk management. Contract management can also be a useful part of digital quality management. If possible, processes are not only designed and honed in digital quality management, but executed directly from the application. In this way, deviations of the lived practice from the agreed specifications can be avoided. Ideally, the application will also promote the quality of collaboration within the company.
There are some providers of digital applications for quality management. Make sure that the applications can be used platform-independently and that the processes can be adapted to the conditions in your company. (Intrexx is one of these providers).